— Written by Sofia Eisenbeiser —
Well, folks, we made it. The last week, the final frontier, time to sink or swim. Luckily, I’ve spent the past 10 weeks with the most expert swimmers of all, our BYB fish. And, boy, have they taught me well. So, let’s dive in!
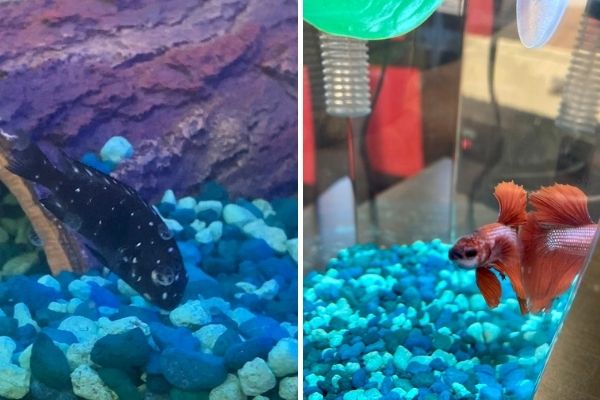
Alright, where were we? In the beginning we discussed play and how science might attempt to concretely define it in lower-level vertebrates whose minds we don’t fully understand (yet…). That was followed up with the discovery that fish like to play laser tag, and that some of them even prefer to play with differently colored lasers!
The first few weeks of my project revolved around more conceptual ideas and thinking about how exactly to quantify qualitative traits. How am I supposed to take something as abstract as the day-to-day of a fish and turn that into cold, hard data?
Well… the answer is actually quite simple: ethograms!
An ethogram is a methodical organization of behaviors observed in an animal or species over a period of time used in the study of animal behavior (also known as ethology). You may recall that I’ve been working with an event-logging software named BORIS to analyze and record the behavior of our fish. Handily enough, BORIS can take my analyses and turn them into numbers which I can turn into different numbers that I can use to build ethograms.
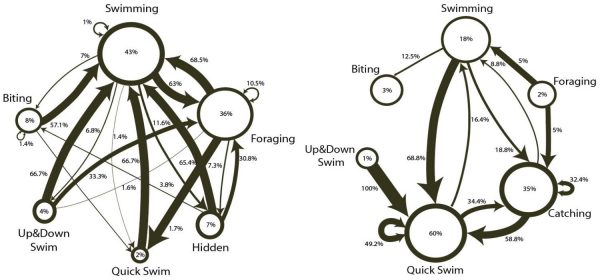
Below you can see an example of a couple of ethograms from one of our cichlid fish, fondly referred to as Cichlid 2. It’s all a bit much at first glance, so let’s break ‘em down. The ethograms that I’ve come up with so far are comprised of circles and arrows.
- The circles represent behaviors, and the arrows represent transitions from one behavior to another.
- The size of each circle corresponds with how much time a fish spends conducting a certain behavior, and the thicknesses of each arrow correspond to how likely a fish is to move from one behavior directly to another.
- The direction of transition is indicated by the location of the arrowhead, and curved arrows indicate that two behaviors can precede each other.

These two particular ethograms represent two different states of Cichlid 2. On the left is a breakdown of normal, unstimulated, everyday behavior. On the right are behaviors which occur only during presentation of a laser stimulus. I don’t know about you, but I see a pretty big difference! Ethograms like these will be great tools to use as I continue my analysis of fish behavior in attempts to answer the question that started it all: do fish play?
And… that’s it! It’s been such a privilege to conduct research alongside the other 2021 fellows and watch all of our projects go through their ups and downs to become what they are today. I’m so proud of all of us, and I look forward to seeing what excitement the last week will bring to close out this fantastic journey. Thank you for coming along with me on the BYBlog! We laughed, we cried, we drank, we sang, and we learned a whole heck of a lot more about fish. Until next time!
