Backyard Brains Logo

Neuroscience for Everyone!

+1 (855) GET-SPIKES (855-438-7745)


items ()

Become a Cricket Pick-Up-Artist with Nick!

So you’re trying to pick up Crickets?

In this day and age there are services for everything; online dating for farmers, pastors, and anyone who’s looking for that special someone. Just nothing out there to help you find that very special cricket love. Well don’t worry, you won’t need a special site or even special skills!  All you need is a couple calling songs and you can find the male or female of your dreams, if in those dreams you happen to be a brown cricket (Acheta domestica).

Nick1

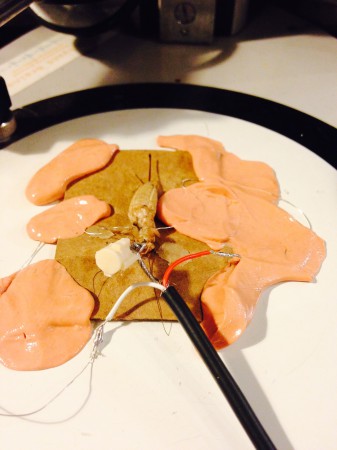
When I posted previously I was in stages of nailing (pinning?) down the right prep to get the best results possible. Suction electrodes were a possibility but proved to be too much of a time consuming, finicky prep. So when I went back to the silver wires, I tried new placements within the cricket and ended up finding a couple sweet spots that yielded some interesting results. Pictured above is the prep that has been giving me the best signal to noise ratio possible to see neuron spikes when frequencies are being played to the cricket. After several trials with this prep we found out that 3, 4, and 5 kHz frequencies would be the best ones to test at this point because this is the range male crickets produce their calling chirps in. So if you can chirp like that you can get a date with any cricket in the land. Quick Pro Tip: the females tend to roam during the day and in warmer weather so that’s when the optimal pickup tones should be tried.

Nick2

This is a 3 kHz frequency trial. Each trial was performed on female crickets with recordings played on their left side (where the wires were placed). These tones were produced manually at the time, however it has become automated through Matlab since then. The color bar above the green, in this case orange, represents each tone being played for roughly 25 trials. The green spikes represent the neuron spiking in reaction to the tone being played. As you can see the 3 kHz produced a lot of neuron spikes. Looking at this makes it seem like 3 kHz would be a “sweet spot” for optimal spiking in accordance to their naturally attuned frequencies, however this response doesn’t always happen.

Nick3

This is the 4 kHz trial, clearly also producing many spikes. Not as many as the 3 kHz trial but according to some literature this range 4-5 kHz is the main calling song brown crickets produce. So going forward, most of my tests will consist of frequencies within this range.

Nick4

The 5 kHz trail producing a poor amount of definitive neuron spikes. Some of the spiking in response to tone playing was removed because it was confirmed to be muscle movement of the cricket and not specifically a neuron responding to sound.

3 kHz:

Nick5

4 kHz:

Nick6

5 kHz:

Nick7

These Raster Plots represent the number of spikes produced by the neurons in the cricket’s ear after the onset of the tone (colored line). So each tick mark represents one action potential.  In most cases there is a delay after the tone before the first neuron fires in response to it. It will take more trials to determine the exact time of it, or to test if it coincides with some other studies.  The y-axis represents what number trial it was and the bottom is time in seconds, with 0 representing tone onset. In the histogram the number of spikes correlates with the time. So each bar represents the number of spikes that occurred during the same time period across trials. Each tone, whether it was 3, 4, or 5 kHz produced valuable data, and showed that each frequency could elicit a neuronal response in cricket’s ears. 3 and 4 however seemed produced a much better response it terms of neurons firing.

With all this information gathered I made a poster and presented it at Mid-SURE. While this shows a clear response to frequencies, I think this information more importantly represents an ability to obtain this kind of data with this simple, accessible, and easy to understand setup.  I will be trying to find the best signal to noise ratio such that I can objectively determine what is a neuron spike vs a muscle signal vs noise. As far as the cricket “cat calling” goes, I know which frequencies should produce a response and will be testing those more thoroughly moving forward, as well as a few frequencies that the crickets should be deaf to, and therefore should not elicit a response as a control.  I have automated tones playing and a randomization protocol which ensures a pure response to the frequency. So now my research will involve tweaking the silver wire placement and playing different series of tones to elicit a response, so essentially the same prep I have been doing this whole summer but much more concentrated now that I have a better understanding of the prime frequencies to play and where to put the recording electrodes, the silver wires. My end goal would be to reproduce this same type of data and conclusions as presented on my poster but with much more trials and many more frequencies. We have the ability, now, to test ultrasonic frequencies like 18 kHz and above, important because the crickets detect these frequencies to avoid being eaten by bats. So many more tiny surgeries are needed to ensure you guys the best possible call to get the male or female cricket of your dreams.