—Written by Sarah Falkovic—
Welcome to my final post on project lie detector! Previously, I have discussed how I have moved from strict skin galvanic response research to P300 signals. Here I am now to update you on this “I saw it” response!
As a quick recap: the P300 signal is an EEG (brain-wave) measurement taken along the midline of the skull. It represents interactions between the parietal and frontal lobe. This sort of measurement is regarded as a recognition based response. It might seem strange that this has implications for lie detection, as it deviates from our typical expectations of a lie detector, such as the infamous polygraph. However, this response can be paired with retooled versions of the traditional “knowledge assessment tests” from the polygraph to form a stronger model. The reason P300 signals are so useful is because they convey recognition, which can show if a subject recognizes context that is unique to a crime. There’s no beating that!
So far, I have been able to rack up a large database of P300 data that I am currently amassing into a neural network. The specific tests I am using involve a novel form of P300 stimulus – that of images! Historically, most datasets of P300 signals evoke their stimuli by presenting letters to the subject that they are prompted to choose between. This is because of the utility this has in forming the P300-speller, an assistive communication device that allows those without the ability to speak the ability to communicate by focusing on letters to spell.
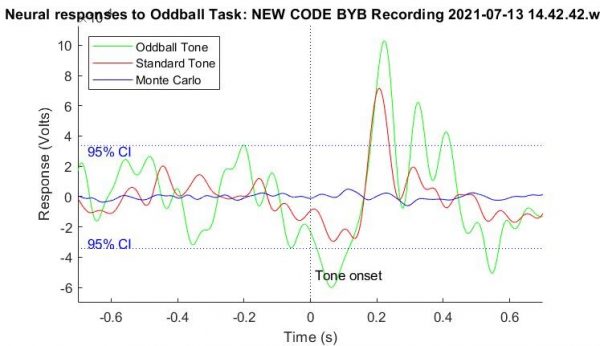
The tasks that I have been using to collect my data involve presenting subjects photos and images, as opposed to letters and words. This has some upsides in that it can provide more potential for observing this phenomenon outside of any language barrier. While I talked about my ‘find the dot’ trials previously, I have expanded my trials to more complex image processing tasks, such as ‘find the spoon.’ For this work, subjects are shown a variety of cutlery, bowls, and plates, and are asked to only count the instances of a spoon. There are objects that look quite similar in this dataset- however, the P300 only appears for the spoon, as shown from some of my data below!

Much better P300 compared to my previous work! While this phenomenon is quite easy to observe on an individual level with the human eye, the biggest challenge for me has been training a computer to recognize these differences between an ‘oddball’ P300 and a neutral stimulus. One of the challenges of these algorithms is that machine learning essentially finds the quickest way to be as accurate in identifying samples as possible.
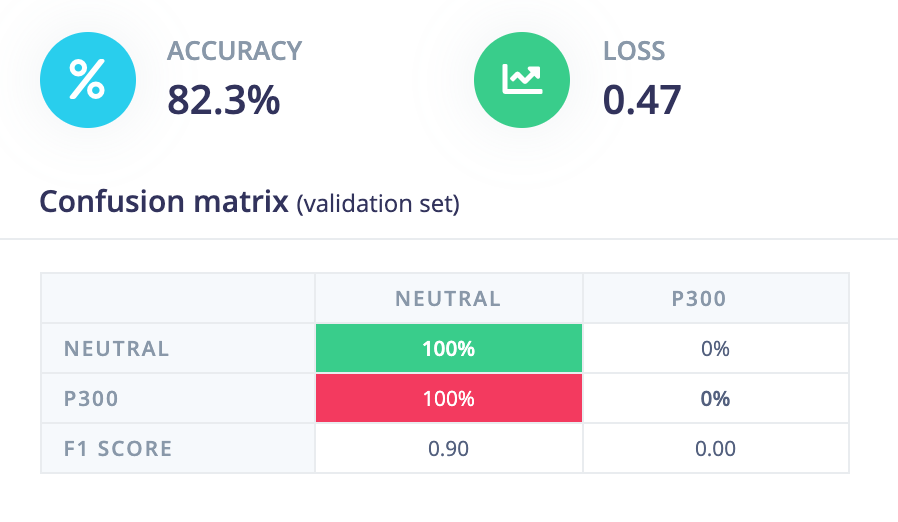
This has meant that my computer tends to identify that classifying all samples by one label is sometimes the most efficient, especially if one sample type is naturally more present than the other. In my case, P300 signals naturally occur less frequently because it is an oddball task, which leads my models to want to classify every sample as neutral, despite the presence of P300s in the learning set. So when I load in my processed data, I need to be sure that I am loading in about as many samples labelled as P300 as neutral non-oddball samples, otherwise errors like this will occur:

While it’s a great accuracy, you can see in the table below that this is the result of too few P300 samples in this test data set. However, the more I work with the neural network, the more I am aware of the downsides of using machine learning for telling the difference between two values. While P300 signals are often easily visible to the naked eye, the biggest way we tell the difference between a normal visual response and a P300 is that P300 signals have a much greater amplitude on average– individual EEG responses may not follow the same pattern. So I am currently looking into making a more toned down statistical model that classifies at the end of each trial by comparing the average area under the curve of the expected P300 signal to the neutral one. In this way, I should be able to see if the oddball scores any differently compared to the neutral stimulus.
Another small win I experienced last week is I found out more explanation as to why my readings tended to be off for my P300 signal. We remeasure the difference between when the computer screen displays the image compared to when the time marker gets shown in the Spiker Recorder app where I record EEG, and we found that my code for presenting the images had a lag of about half of a second- so I have retroactively gone back and altered how I sample my older P300 signals to harvest accurate P300s.