After spending 24+ hours in a hot closet with strangers, I’ve learned a couple things.
Walk with me (like lovers do)
So far, I have recorded from a lot of people with a large range of experience levels in search for a biomarker for meditation- e.g. something more reliable than a person just “saying so” when they’re meditating.
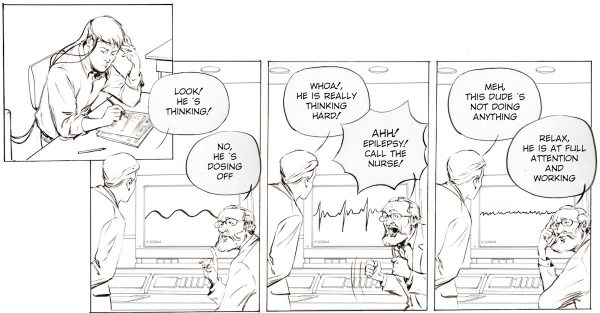
When the meditators close their eyes, it’s almost like I’m leaving them in a closed room: there’s nothing telling me what they’re thinking and it’s hard to tell if they’re doing anything different from just sitting there with their eyes closed.
The known factors at that point in time are:
- They volunteered to participate in this meditation study.
- They live in Michigan.
- They have just heard me say something along the lines of, “For this meditation task you will adopt your normal meditation technique from when I say begin to when I say stop, close your eyes, begin.”
With EEG, we can’t see what you’re thinking, but hopefully we can differentiate between the kind of thinking you’re doing. I am going to see if alpha waves can be used as a lie detector for “real meditation”.
Quick and easy 40 minute Data Recipe
- Prepare the pan: low cost equipment for scalp recordings (a shameless BYB plug)
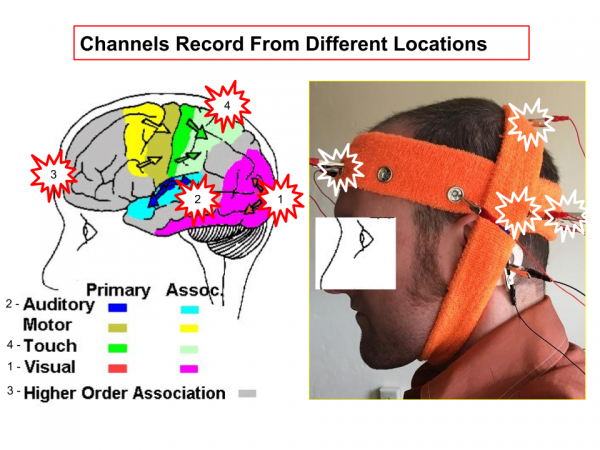
- Modify headband to record from locations that are thought to process different areas of interest.
- Capture ingredients
- Cast a wide net and record from as many people as possible!
- (scheduling is hard and people are flaky, tread strongly)
- Mix thoroughly and consistently
- Flip a coin to determine order of tasks – independently random so that any difference between meditation and rest is not just due to ordering
- A protocol script, to ensure that you are saying the same thing every time to induce the different mind states (*relies on participant obedience and self report)
- Take notes, never trust your memory
- Put ‘em in the oven
- Record in a consistent environment
- A lil dark, a lil loud, a lot hot, but consistently so
- Acquire fresh, local, organic data
- ~40 minutes session
- eyes closed during all 2-4 tasks
- meditation = “adopt your normal meditation technique or focus on your breath”
- rest – “just sit with your eyes closed”
- rumination = “decide whether [the negative/neutral word] describes you and follow that train of thought”
- survey = “how old are you, describe your experience during this meditation, how many times a week do you meditate…”
Talk to me: Labeling Data Descriptively Is Mindfulness Based Stress Reduction
My big pile of data comes out to approximately 1000 minutes of recordings, with 2-4 tasks each, recording from 3-4 locations from meditators with 0-1000 hours of experience. With each added variable, the size of the dataset increases exponentially and gets hard to keep track of!

Let’s get wavy
Remember, frequency bands can be measured from any location and we are measuring from the scalp i.e. there is no physical contact with neurons, just big groups of them yelling at us!
- 0.5 – 3 Hz, Delta – large slow waves, less interesting things your brain is doing (like deep sleep)
- 3-8 Hz, Theta – drowsy, literally and theoretically in between sleep and awake
- 8-12 Hz, Alpha – idling mode of synchrony, ex: your visual cortex is not receiving complex information from your eyes
- 12-24 Hz, Beta – “many different conversations occurring between neurons” canceling each other out
Choose your fighter: L-gop vs Maria
Let’s look at the effect of condition (meditation) on the spectral power across the EEG bands. Spectral power means that for each range of frequencies, we’re looking at the amount of time that was spent at that frequency band. For example, according to my hypothesis, meditators will have more alpha frequency brain waves during meditation compared to rest. For this figure, I wasn’t interested in the differences between locations, so the EEG power from all brain regions was averaged.
As you can see from our corresponding battle stats, Lagopoulos has me beat. There is a lot more variance in my data, in terms of error bars (how confident I am about my mean), equipment, and participant meditation technique and experience level. But even with this amount of control his error bars are still pretty big, and obviously overlapping (which is probably why he omitted the bottom half of his error bars) which is to say that his values (although more significant that mine) are still not quite significant.
It’s looking bleak for the alpha wave – if you try to use it as a lie detector for meditation it will probably be lying to you, but stay tuned for next week where I will attempt to “p-hack” the data and see if certain qualities about my meditators are responsible for the data being all over the place!
Yours faithfully,
Maria
PS: Blink and you’ll miss it (again)
*In my figure, it looks the most difference between meditation and rest occurs in the delta band, but I am omitting all frontal delta data due to eye blink artifacts. In the Lagopoulos paper, “ten (10) minutes of eyes – closed EEG was recorded during each task”, meaning they recorded the eye artifacts and ended up cutting out approximately half of the recording when there was any eye activity.


