After trials and errors, the electrophysiology setup is ready to collect usable data. I have updated the current version of the protocol and setup on the instructions tab.
For housekeeping, I give each grasshopper that participates in the experiments a name in the format of [day][month][letter indicating order]. For example, a grasshopper whose DCMDs are recorded today would be named 0710A. If I request the help of another grasshopper, that subject would be 0710B.
The first series of experiments I am performing aims to record and analyze the activity of the DCMD neuron when the black ball is approaching the grasshopper’s eye. My hypothesis is that the neuron’s peak firing/activity rate would be around the time when the simulated ball would hypothetically collide with the eye.
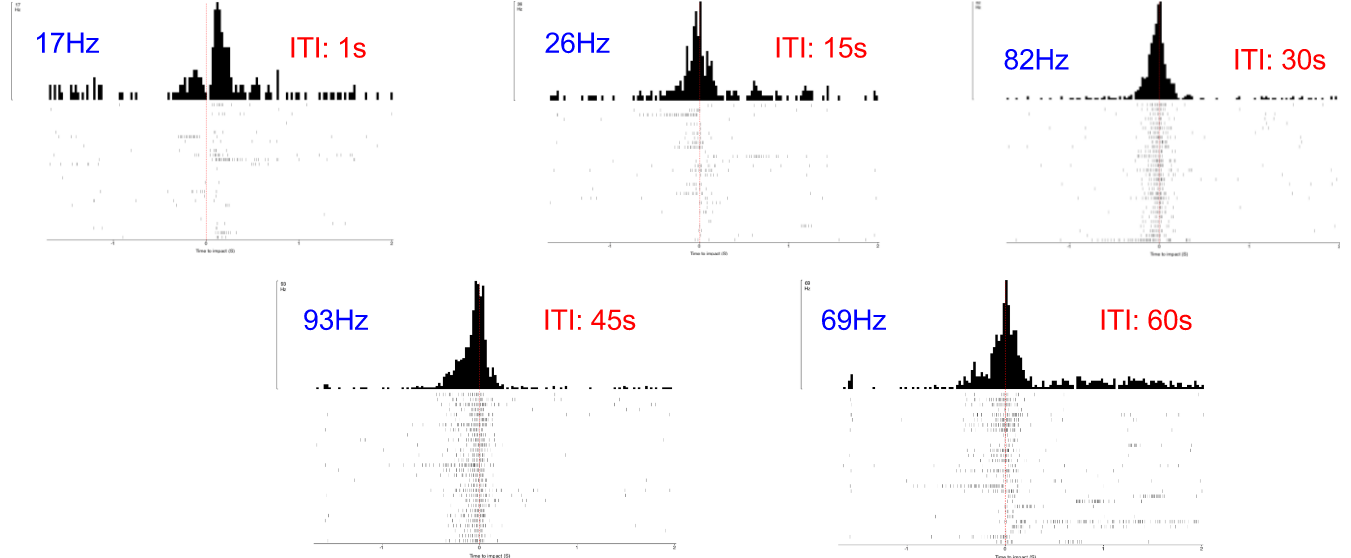
Before I performed the first of these experiments, I needed to determine the “ideal” intertrial interval, ITI, when no visual stimulus is present. This interval between two stimuli is necessary due to the possibility of habituation to the stimuli. If the ITI is too short (e.g. 1 second), the DCMD neuron might no longer consistently fire. I need to quantify the neuronal responses to different intervals and identify an ITI that will be long enough for the neuron to respond to most or all of the approaching balls. The ITIs I chose are: 1, 15, 30, 45, and 60 seconds. All other experimental parameters are kept constant across all ITI tests: with the iPad screen 0.10m from the grasshopper’s eye, balls of 0.06m radius approach at -2m/s (negative for the increasingly shortened distance between the eye and the object). 30 trials per ITI test. Here are the results!
- Horizontal axis: 0 (red dash line) is the time of impact/collision between the eye and the ball. The graphs show the DCMD activity 2 seconds before and after the impact.
- Vertical axis: Two representations of the clusters of the DCMD spikes, which mostly are around the time of impact. Other “spikes” more than 0.5sec from 0 either direction are most likely noise, a common trouble for electrophysiology recordings, or other strange neuronal activity.
As you can see, the DCMD firing rates for the ITI of 1sec and 15sec are low and less consistent compared to the rest of the ITIs. The 45sec ITI yields relatively the best profile of the DCMD activity, and so I will use this ITI for my first series of experiments.
In this series of experiments, these are the constants across all trials:
- Distance from the grasshopper’s eye to the iPad screen: 0.10m
- Intertrial interval: 45sec
- Object size: 0.06m
- Trials each pair of object size and velocity: 16
- Total experiment time: 60min
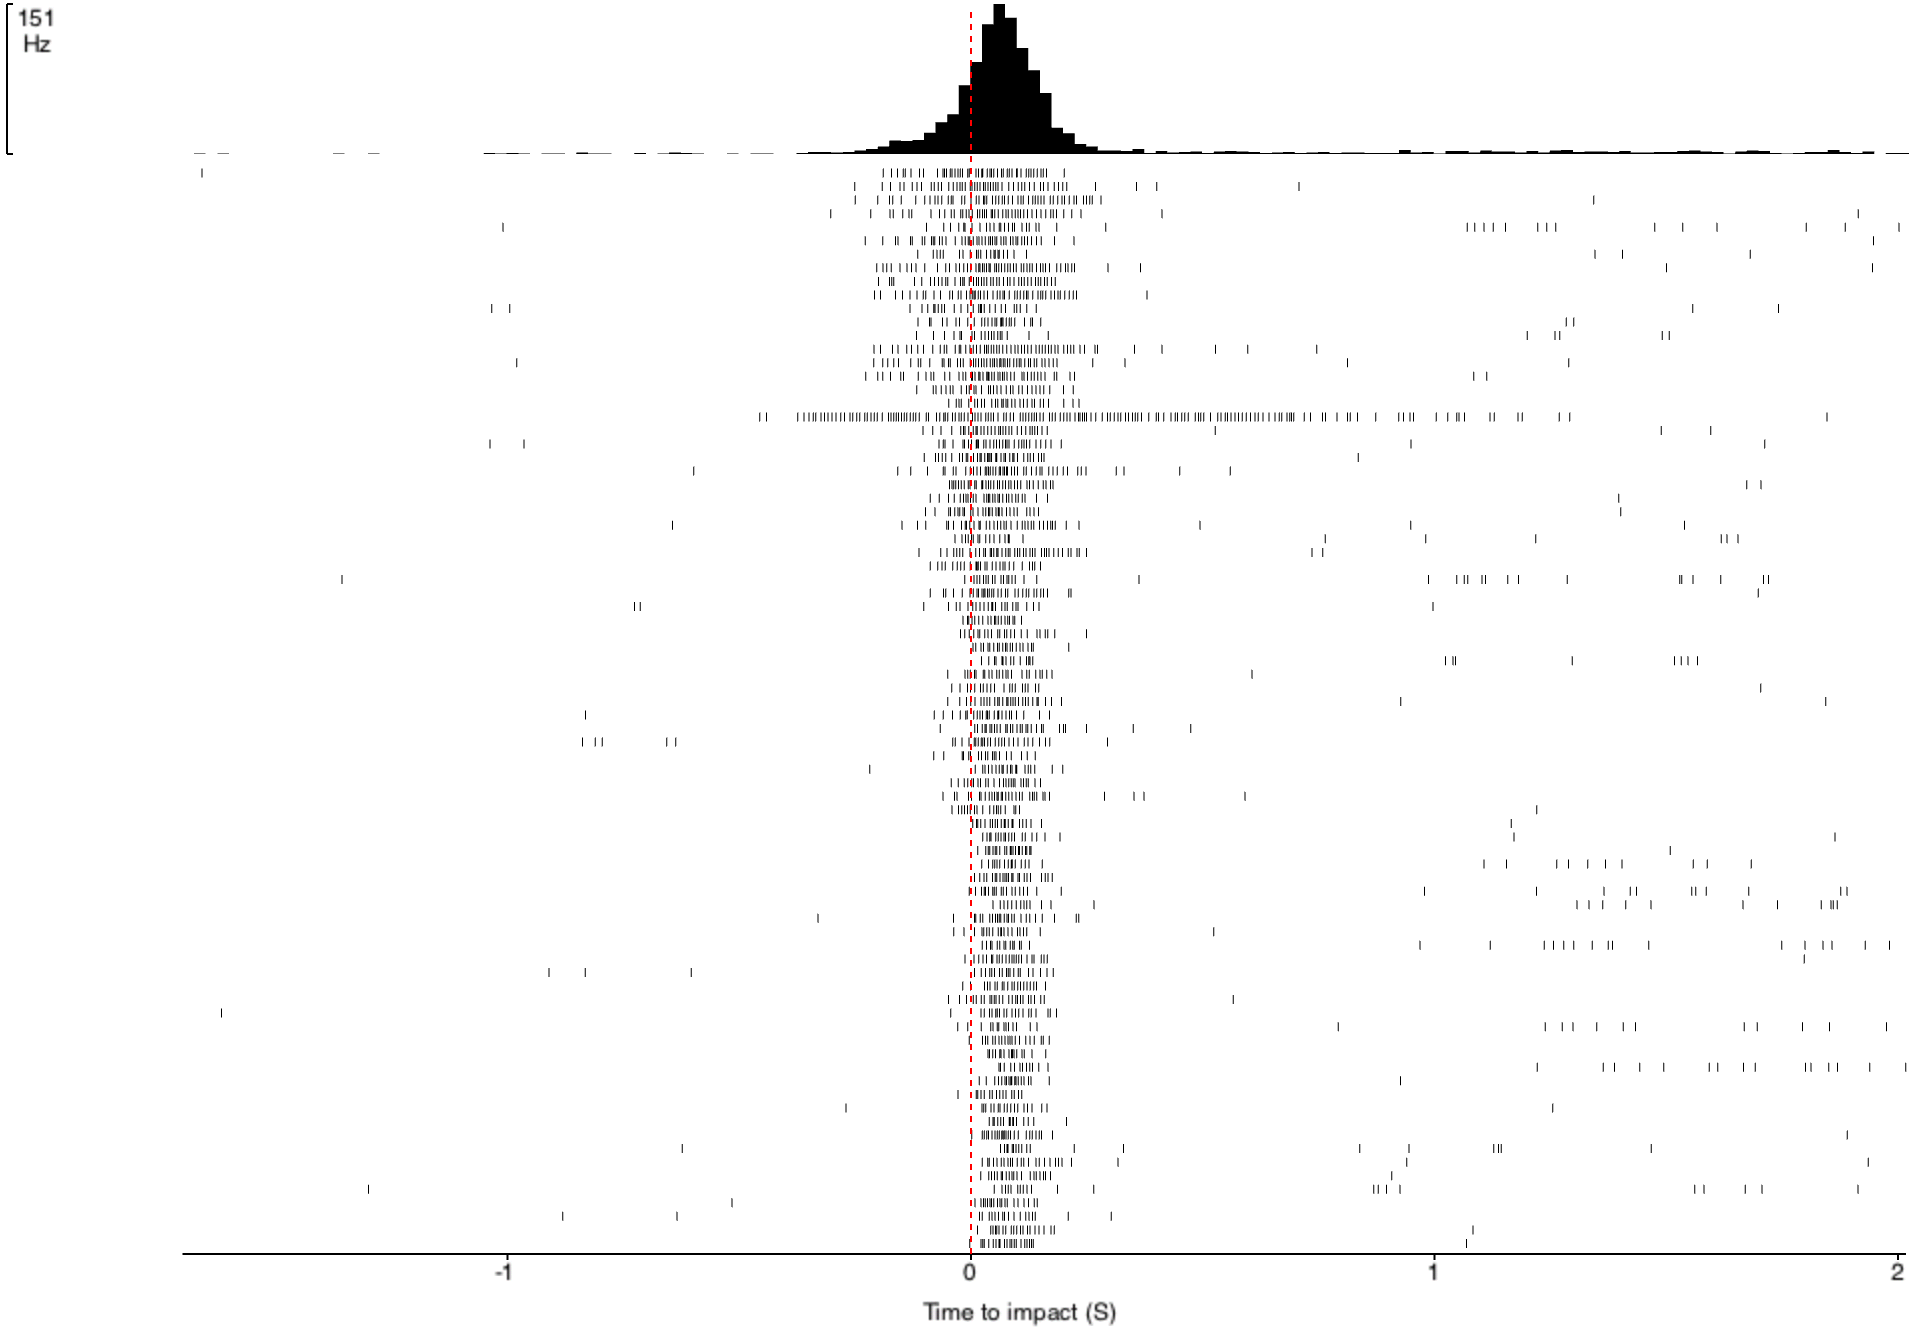
- The approach velocities are varied: -2, -4, -6, -8, -10m/s. Each ball is a combination of the object size and one of the velocities.
Preliminary results:
As expected, DMCD peak activity clusters around the time of impact, at 0sec. Interestingly, this peak is about 90msec after the supposed time of impact. Some questions I must ask are: Does this result make intuitive sense, when the neuron supposedly acts as a warning and escape mechanism and its activity should hypothetically peak before the collision so the animal would jump away to avoid being hit? Is the iPad screen big enough and close enough for the grasshopper to really “sense” the danger of collision? What are the possible factors in the iPad app that might yield this result? Is the simulated time of collision (when the ball of a particular size stops expanding) accurately computed and depicted on this graph? I will continue to investigate this and make appropriate adjustments.
By Dieu My Nguyen

