Hello, everyone! Welcome back to the last installment of silkmoth updates. Things are starting to wrap up here this summer, and I’ve begun to analyze the data I have been collecting.
Behavioral Data Analysis
Last post, I explained the behavior assay that I am using with the moths to demonstrate how the sex pheromone bombykol can alter behavior. I have run over 100 trials since then and have been working on visualizing my data set. The Google Sheets pivot table feature has been a serious life saver for quick filtering and data wrangling. If you haven’t used it before, do it! Or I can force you to sit through an overly-enthusiastic demo like the rest of my labmates (sorry guys).
The moths have three choices during the experiment: they can choose the stimulus side, the control side, or have no response. No response is defined as no movement after 30 seconds of being placed in the chamber. Overall, the moths tend not to move unless they have a really good reason to expend their limited energy. Thankfully, this makes my job as an observer fairly easy, although boring at times, and the behavior response to bombykol very obvious.
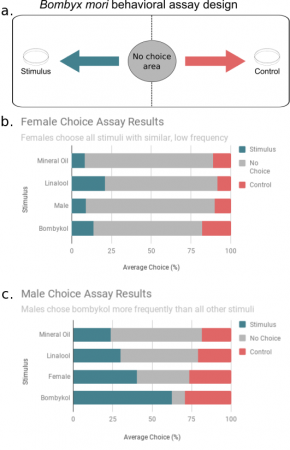
My first visualization was to show the spatial preferences of the moths in the arena for each stimulus. Below is a schematic of the arena paired with horizontal bar charts for males and females for each stimulus.
 Schematic of behavior task. B. Choice results for all female trials. C. Choice results for all male trials
For the females, behavior does not appear to be influenced by stimulus type- overall the bars look about the same with the majority of the time ‘no choice’ being made. For the males, it can be seen that when a female or synthetic bombykol is present, there is a greater amount of response. I believe the bombykol response is more profound than the female response for two reasons. First, the concentration of synthetic bombykol I’m using is very high. Second, sometimes when a female is in the arena she does not protrude her gland that releases bombykol, which makes it impossible for the males to know she is there.
Although the plots above do a good job with spatial representation, they not account for what I truly care about- reproductive behavior. Sometimes a male can be doing reproductive behavior and will be so excited that he dances around the arena and ends up on the control side by the end of the trial. To account for this, I’ve made a second plot with average frequency of reproductive behavior for each stimulus type. It can be seen that bombykol and females induce far more reproductive behavior than linalool or mineral oil. Linalool and mineral oil should technically have no reproductive behavior, but sometimes things can get contaminated even while I’m using separate chambers. By the end of some days, I’m pretty sure I am covered in bombykol, so I have become more careful in what order I run experiments.
Now that the data has been visualized, I am working to run statistical analysis on it. I will need to run a model that accounts for testing cohorts of moths multiple times (versus each trial having a new sample). This will likely be a repeated measures analysis of variance (RM-ANOVA) with post hoc Tukey test. I’ve been communicating with one of my teachers back at Westminster to determine which model is most appropriate for my dataset and will have those results soon.
Electrophysiology Problems & Solutions
Now onto electrophysiology! Last time I checked in, I was having difficulties recording consistent electroantennogram (EAG) data from the moth antenna. I was able to determine that the issue I was having was due to a poor connection between the electrode and the antenna. I determined this through a variety of experiments using a resistor instead of the antenna and applying various types of conductive gels and pastes. When the connection was good, the resistor would flat line and have no response to any of the stimuli blown on it (as it should since it’s not alive). When the connection was poor, it would give inconsistent, biological-ish responses due to the connection moving around, gel interacting with different substances and additional unknown factors.
For a few days I thought the EAG portion of my project was done- how could I determine if the connection was ‘good’ if a poor connection gave something that could easily be mistaken as biological? After running many troubleshooting trials and reaching out to a variety of resources, it turns out that when I blow on the antenna and it gives a large, high frequency spike, the connection is poor. So, I sporadically blow on the prep throughout the trial to make sure things are going well. I also switched from using an electrode gel to a more expensive electrode paste that appears to last much longer and create a better connection.
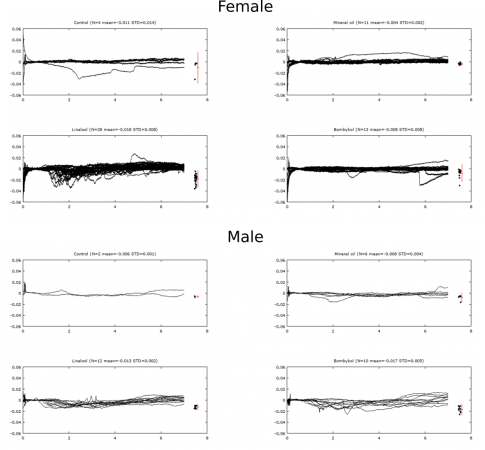
With these new methods I have begun to collect data that is much more consistent. I am only testing 3 compounds now: mineral oil (solvent/negative control), linalool (positive control) and bombykol (sex pheromone). Last week I ran trials in males and females and observed different responses. The females have a larger response to linalool and no response to bombykol or mineral oil, while the males response to linalool and bombykol. Seen below is an overlay of raw data from a trial with males on the left and females on the right that displays the response. This is similar to what has been found in research and has given me full confidence that my new method is working.
As you can see, this data lacks alignment, which makes further analysis very difficult. To align the data, I created a DIY laser beam with an LED and photoresistor that indicates when the stimulus is present.

Image of set up. Cotton ball blocking light signal across LED and photoresistor. Stimulus is on cotton ball and pulled into fan by air current.
This setup allows me to align each trial to stimulus onset. I am currently working with Ben on a code in Python that will automatically sort through the data and the statistical values we need to run analysis. Below is an image of the raw data in spike recorder. The red line is the stimulus marker and the green line is the recording from the antenna. You can see that when the stimulus (bombykol) is presented there is a slow hyperpolarization in the antenna as seen in previous literature.
I am psyched with the progress I have made since the last post. While I’m collecting additional data this week I will also be building a poster and preparing the classroom manuals and visuals for my project. I believe communicating one’s work is often the most difficult, yet important part of the scientific process. I’m looking forward to sharing my work and receiving some feedback on how to make it better. I hope to have more updates as I continue to work on this project while finishing up my bachelors degree this Fall. Thanks for following along and stay tuned!


