-
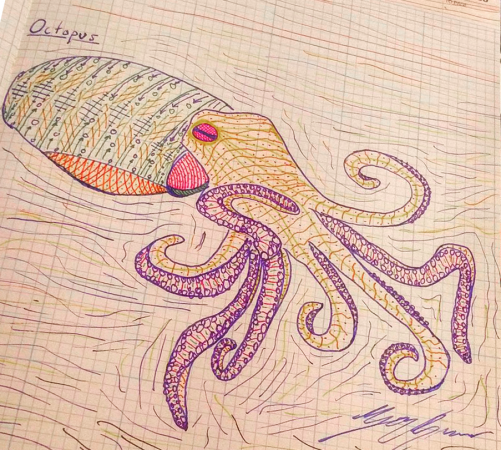
 EducationOh hey there! Long time no see, why don’t you have a seat and hear what I’ve been up to since my last blog update. If you were at the Ann Arbor 4th of July parade you might have seen me dressed up as a beautiful purple octopus (or maybe it was a squid? The […]
 -
 EducationHello everyone! It’s a been over a month since my project began on studying the diet and attempting taste manipulation of the Drosophila melanogaster. Before my experiments could begin I faced many software and hardware issues. The flyPAD itself is an extremely thin 0.6mm PCB board so every slight bend of it can result in a […]
 -
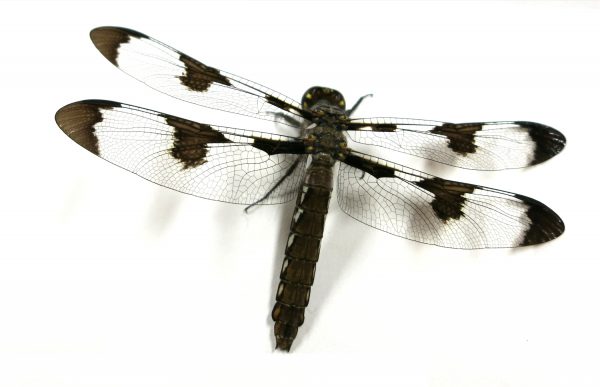 EducationChanging Course In my last post, I talked about how I was essentially replicating the Paloma article (previously linked) in a DIY manner. This is no longer the case. The primary goal at this point is to record from the TSDN tracts, located on the ventral portion of the dragonfly’s “neck” area (seen as two white lines […]
 -
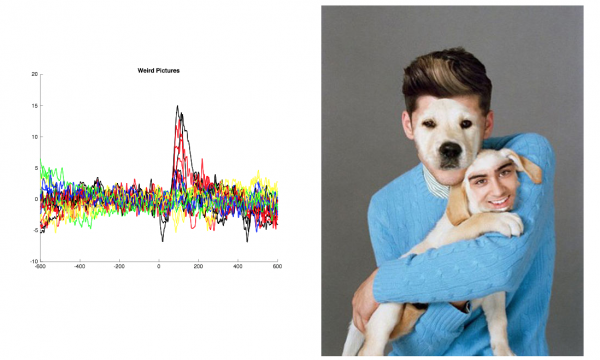 EducationG’day again! I’ve got data… and it is beautiful! More on this below… I am pleased to update my progress on my BYB project, Human EEG visual decoding! If you missed it, here’s the post where I introduced my project! Since my first blog post, I have collected the data from 6 subjects with the stimulus presentation program […]
 -
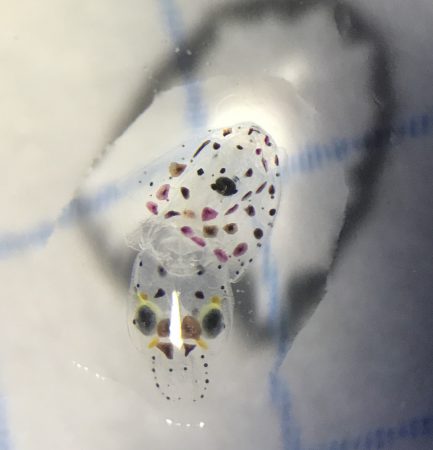 EducationIntroduction to the project … Hi, everyone! Last week marked the halfway point of my time as a fellow here at Backyard Brains! Recently, I’ve succeeded in building a rig and recording video footage of my Squid Hatchlings! I’m excited because it means I can start gathering quantifiable data! The squiddos have kept me pretty busy during these weeks, […]
 -
 EducationWho would have thought a summer fellowship would grant you sleep sessions during work hours! Not just that, but it also comes with the ability to explore the deepest phases of sleep and access to unlimited Delta waves that come in all shapes and heights! Well, that can only happen at Backyard Brains, right from […]
 -
 EducationIntroduction to the Project Hi, Haley again!! It’s been an exciting couple of weeks- I’ve become more familiar with mosquitoes than I ever thought I would, learned a TON more Matlab, and even got a few recordings!! My work recently has focused on perfecting the methodology needed to successfully tether a mosquito in a position mimicking […]
 -
 FellowshipHi! I’m Shreya and I just graduated from the Dwarkadas J. Sanghvi College of Engineering affiliated to the University of Mumbai in Electronics Engineering. During the last two years of my undergraduate study, I spent most of my vacations, free time and some weekends working as a research intern at the Indian Institute of Technology […]
 -
 EducationHi, I’m Ilya Chugunov, a rising sophomore at UC Berkeley, majoring in Electrical Engineering and Computer Science. My hobbies include: hiking, archery, and pondering deeply about why my code doesn’t compile. As a member of the Backyard Brains fellowship this summer I will be studying the fascinating, and possibly unseen, behaviors of the California Two […]
 -
 EducationHi, I’m Zach Robinson. I’m a senior in Computer Science Engineering at the University of Michigan. I’m working on the Songbird Identification System. This is an ongoing project that was started in January 2017 and will continue development throughout the year. Thus far we have developed an initial classifier model using machine learning, setup a […]
 -
 EducationHey everyone! My name is Spencer and I just finished my freshman year at Dalhousie University in Halifax, Canada (yes, where the maple syrup and igloos are). I’ll be studying Neuroscience and Immunology there for the next three years. I’m originally from Vancouver but ended up all the way on the other coast to study in Halifax. […]
 -
 EducationAbout Me Hi everyone, I’m Jaimie. I just graduated from Boston’s Northeastern University in Behavioral Neuroscience. My academic background is in biology, but I picked up some engineering and coding skills through previous lab research. Originally I’m from the Chicago area, so I’m pretty familiar with the Midwest atmosphere, though I had never been to Ann […]