Backyard Brains Logo

Neuroscience for Everyone!

+1 (855) GET-SPIKES (855-438-7745)


items ()

Real Time Mind-Reading

G’day mate, how are ya?

Thank you for waiting for the updates on my research on Human EEG Decoding (aka Mind Reading).

Since my last post, I have tried to decode human EEG data in real time and… guess what…I succeeded! Hooray!

I first analyzed all the data I have collected so far to verify and evaluate the different patterns of brain signals on different images.

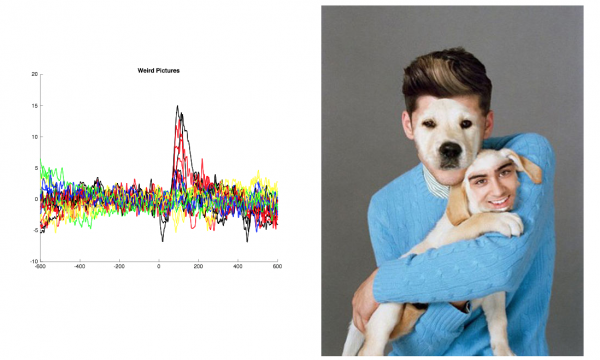
I analyzed the raw EEG signals, and ERPs (event related potentials) in each channel and also in each category of images. I could definitely notice the N170 neuron specifically firing when the face was presented, while it stayed mostly quiet during the presentation of other images. However, there was no significant difference between any of the other images (house, scenery, weird pictures) which indicated that, at least with my current experimental design, I should begin focusing on classifying face vs non face events.

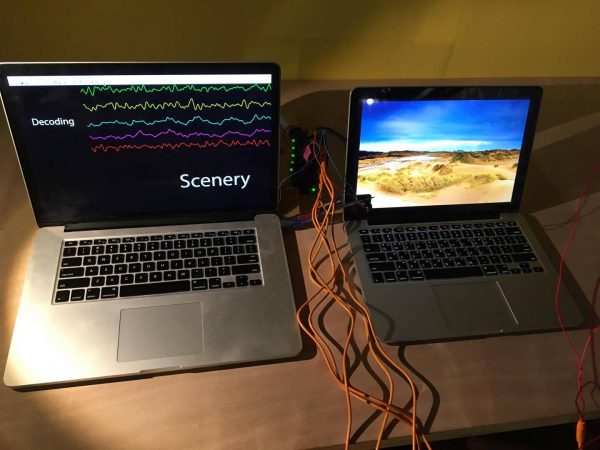
Then I wrote MATLAB code which collects the data from human subjects and decodes their brain signals in real time. In the training session, 240 randomized images (60 images for each 4 categories) are presented to subjects to train the support vector machine (one of machine learning techniques that are useful for classifying objects into different categories). Then, during the testing session, we analyze the EEG responses from each randomized image in real time to correctly predict what image is actually presented. Since it was real time classification, the coding was complicated, and I also had to make it synchronize with my python image presentation program…

Also, I had to check the hardware and outside environment which could deteriorate the performance of the spikershields and the classifier! Some blood, sweat, tears, and a lot of electrode gel later… I had it running!

After all the hard work, I began running trials where the goal was to classify face vs scenery. I chose natural landscapes as they seem to be the most non face type of images. After a training session of 240 images for each subject, we tested 50 faces and 50 scenery images (order randomized) to check our real time algorithms.

The result was very satisfying! Christy and Spencer (the coolest BYB research fellows – please see my previous blog post) scored averages of 93% and 85% accuracy rate in 5 trials, which proved that we can classify the brain signals from face vs non face presentations successfully. The brain signals were so distinct that we could see specific stimulus distinction from ERPs in training and testing sessions, but they were not strong enough to observe in the raw EEG signals from each channel. However, just because they weren’t obvious to the human eye… doesn’t mean the computer couldn’t decode them! The machine learning algorithms I prepared did an excellent job classifying the raw EEG signals in real time, which suggests that a future in which we can begin working on more advanced, real-time EEG processing is not far away! We’re edging closer and closer to revolutionary bio-tech advancements. But for now, it’s just faces and trees.

And now, the capstone of my summer research!

We fellows worked long hours for 6 straight days filming short videos for TED, each of which focused on one of our individual projects!

It was stressful but exciting. I never would have expected I’d have the opportunity to present my research to the world through TED!

My best subject Christy generously agreed to be a subject for my video shoot.

We presented three experiments:

  1. EEG recording and ERPs
  2. Real Time decoding with no training trials
  3. Real Time decoding with training trials

The first experiment was to show how we can detect differences between face vs other images via ERPs by the presence of N170 spikes. The second experiment was to demonstrate the difficulty of real time decoding… and the third experiment was to show how we can really decode human brain in real time with limited information and few observable channels.

All the experiments were successful, thanks to Greg, TED staff, and Christy!

For the videos, I had to explain what was going on with the experiment and what is implied by the results of each experiment. In preparation for those “chat” segments,, I needed to study how to best explain and decompose the research for the public, so that they may understand and replicate the experiment. The educational format was definitely a good experience to prepare and present my research to different audiences.

Please check out my TED video when it is released someday! You’ll probably be able to see it here on the BYB website when it launches!

To wrap up, I’ve enjoyed my research these past 11 weeks. Looking back what I have done so far during the summer, I see how far I’ve come. This fellowship was a valuable experience to improve my software engineering and coding skills across different programming languages and platforms. I also got a crash course in hardware design and electrical engineering! I learned how to design a new experiment from scratch using many different scientific tools. Most importantly, I learned more about the scientific mindset, how to think critically about a project, how to analyze data, and how to avoid unsubstantiated claims or biases.

Even though mind-reading was my project, I couldn’t have gone it alone I would like to say thank you for everyone in BYB who supported my project, including Greg, who continues to guide me in the scientific mindset, teach me how to conduct experiments, and helps me to analyze data and present the research effectively to outsiders. Thank you to Stanislav, who put forth a lot of effort to help me verify and build my software. To Zach who helped me build and test the hardware, to Will who was always there to help me out for any matters I had during my time here, and to Christy and Spencer who were the best subjects always sparing their time for the sake of science. I am sure that my experience here was a step forward to becoming a better researcher. My project is not finished, it has really just begun. I am planning to continue researching this mind-reading project. One channel decoding and classification of non face images will be the first step after this summer.

Thank you so much for your time and interest in my project. Stay tuned….


Promising Results in Detecting the Detection of Faces in the Brain!

G’day again! I’ve got data… and it is beautiful!

More on this below… I am pleased to update my progress on my BYB project, Human EEG visual decoding!

If you missed it, here’s the post where I introduced my project!

Since my first blog post, I have collected the data from 6 subjects with the stimulus presentation program I developed. The program presents 5 sets of 30 images from 4 categories (Face, House, Natural Scene, Weird pictures). Since the images are randomized, I have small, color-coded blocks in the corner of each image which I use to record which stimulus is presented when.

I needed to build the light sensor to read the signals from these colored block. I used a photoresistor at first, however, there was some delay on the signal, so I decided to use photodiodes which had a faster response. Since I do not have an engineering background, I had to learn how to read circuits and to solder to build the light sensor. This was new territory for me, but it was very interesting and motivating. After building up my device, I collected data from 6 subjects from 5 brain areas (CPz, C5, C6, P7, P8) that are thought to be important in measuring brain signals related to visual stimulus interpretation.

Figure1. Data recorded from DIY EEG gear. 5 channels from 5 brains areas (orange, red, yellow, light green, green) and 1 channel from photoresistor (aqua) that was replaced by photodiode

Figure2. A circuit for photodiode(top)  and the photodiodes I built (bottom)

Figure3. Checking each channel from the Arduino. One channel (Yellow) on the back of the brain is detecting alpha waves – 10 Hz waves  

Figure4. Spencer (top/mid) and Christy(bottom), our coolest interns, participating in the experiment

With the raw EEG data collected from each subject, I averaged them to get the ERP (Event Related Potential) to observe what the device detected from the data. ERPs provide a continuous measure of processing between a stimulus and a response, making it possible to determine which stages are being affected by a specific experimental manipulation, and also provide excellent temporal resolution—as the speed of ERP recording is only constrained by the sampling rate that the recording equipment can feasibly support,  Thus, ERPs are well suited to research questions about the speed of neural activity.

Then I performed Monte Carlo simulations to verify the statistical significance of the spikes in ERP data. Monte Carlo simulation is a broad class of computational algorithms that rely on repeated random sampling to obtain numerical results. With 100 random samples for each category, the analysis indicated that we had statistically significant spikes across the graph, especially in N170 in face images, which was very meaningful for my research.  N170 is a component of the event-related potential (ERP) that reflects the neural processing of faces, which supported that we have good detection on faces across subjects compared to other categories.


Figure5. ERP data from 6 subjects for each category of images. Significant response in N170 (negative peak after 170 ms after the stimuli presentation) is detected in the face

After verifying the statistical significance of the data, I used k-means clustering, a method of vector quantization that aims to partition n observations into k clusters in which each observation belongs to the cluster with the nearest mean, serving as a prototype of the cluster. K-means clustering indicated that difference between subjects was more significant than the difference between trials and that the difference between trials was more significant than the difference between categories. And, much to my excitement, it was obvious that the response to faces was distinguished from other categories across the number of averaging data sets.

With the insights from k-means clustering, I finally performed the machine learning techniques I’d been studying to analyze my accuracy at classifying what category of images people were looking at during the experiment by looking at the raw data. I performed the most popular pattern classifiers such as “linear support vector machine,” “quadratic support vector machine,” “cubic support vector machine,” “complex trees,” “gaussian,” “knn,” and so on… I used these methods on a single subject and a set of 6 subjects with and without averaging every 5, 10, 15, 20, 25, 30, 50, 75, 150 vectors of EEG data. Support Vector Machine showed the best performance among other classifiers with more than 50% of accuracy for each class with averaging data showing the better performance as expected.

One Subject Raw

One Subject Averaged


Six Subjects Raw

Six Subjects Averaged

Figure6.  K-means clustering results with averaging every 5, 10, 20, 50 75 vectors of the EEG data for a single subject(first 2 graphs) and 6 subjects(last 2 graphs). Y axis indicates 4 categories of the images (1: Face, 2: House, 3: Natural Scene, 4: Weird pictures), further illustrated by the red lines. The graphs from 6 subjects indicate that combining multiple subjects introduces too much variation to identify faces within the group. However, the graphs from a single subject indicate that face can be distinguished from other three categories.

Again, with the data from k-means clustering, and the Machine Learning classifiers I mentioned before, I then applied a 5-fold cross validation with and without averaging every 5 EEG data. In 5-fold cross validation, each data set is divided into five disjoint subsets, where four subsets are used as training sets and the rest are used for a test set. SVM showed the best performance among other classifiers with more than 50% of accuracy for each class with averaging data showing the better performance as expected.

One subject, SVM, no averaging


One subject, SVM, averaging 5


Six subjects, SVM, no averaging


Six subjects, SVM, averaging 5


Figure7. The results from pattern classification with SVM . Both one subject and 6 subjects achieved good results with averaging every 5 vectors of the EEG data, producing a better result than without averaging, and data from single subject producing a better result than 6 subjects.  (The darker the green down the diagonal the better, that’s the accuracy of predicting specific classes)

So now I am working on real time pattern classification so that I can detect what people are looking at without averaging multiple sets of data. I will perform spectral decomposition to compute and downsample the spectral power of the re-referenced EEG around each trial. The spectral features from all of the electrodes will be concatenated and used as inputs to pattern classifiers. The classifiers were trained using various pattern classifiers to recognize when each stimulus category is processed as the target image in real time; a separate classifier will be trained for each combination of stimulus category and time bin. Next, the trained classifiers will be used to measure how strongly the prime distractor image is processed on each trial. Finally, subjects’ RTs (to the probe image) on individual trials will be aligned to the classifier output from the respective trials.

The successful result of this research will make this kind of neural decoding accessible for any neuroscience researcher with an affordable EEG rig and provide us an opportunity to bring state-of-art neurotechnology techniques, such as brain authentication, to life. Please keep an eye on my project and feel free to ask any question. Toodle-oo!


BYB’s Odd Consciousness Detector

Welcome! This is Kylie Smith, a Michigan State University undergraduate writing to you from a basement in Ann Arbor. I am studying behavioral neuroscience and cognition at MSU and have been fortunate enough to have landed an internship with the one and only Backyard Brains for the summer. I am working on The Consciousness Detector – an effort to bring neuroscience equipment to the DIY realm in a way that allows us to learn about EEGs, attention, and consciousness. It is my mission to create an oddball task that elicits the P300 signal in such a way that can be detected on BYB’s EEG machine. Let me break it down:

An oddball task is an attentional exercise in which a participant sees or listens to a series of repeating stimuli. These stimuli are infrequently interrupted by a novel stimulus called the oddball stimulus. The participant is asked to count or press a button for each oddball stimulus that is seen. Named so for its positive change in voltage occurring around 300 ms after the appearance of the oddball, the P300 can be seen when the participant is attending to the stimuli and the oddball they had been waiting for arrives.  This signal can be detected by an electroencephalogram, or EEG. EEGs use a series of small, flat discs, called electrodes, in contact with the scalp to detect changes in voltage through the skull. The EEG detects the changes in the electrical activity of neurons and transmits the detected signals to a polygraph to be analyzed. Outside of my project, EEGs can be used to help diagnose certain neurological disorders and help pinpoint locations of activity during seizures.

So why is this project worthwhile? Consistent with BYB’s mission statement, we want to bring neuroscience to everyone. Your average neuroscientist spends years learning the mechanisms behind brain funtion in order to use this knowledge practically. Then the equipment must be conquered – it is often complicated and lots of time is dedicated to mastery. By hacking their own EEG and producing it from basic electronic components, BYB is able to bring this machinery to you – and that is an incredible thing. Learning the principles behind EEG recording and how to use such a machine is something that few have the opportunity to do – and now you can do it in your living room! The idea behind The Consciousness Detector is used in the medical field. Patients with severe brain damage can be given an auditory oddball task to objectively predict recovery of consciousness through the P300 that is or is not present (If interested, please see: Cavinato et al. (2010) Event-related brain potential modulation in patients with severe brain damage). We are bringing medical techniques used to predict prognosis to you. Yay!

brain hat (3)

The current BYB EEG headband is being employed to record from the parietal lobe, as this is where the P300 is detected the strongest. A better apparatus for holding electrodes in place will most likely be introduced down the line. I have high hopes to pop some rivets into a home-made brain hat and begin an EEG cap trend. For now, this is what I’m working with:

BYB arduino (3)

Backyard Brain’s EEG system uses two active electrodes, the electrodes recording activity, and a ground to eliminate noise common to the head. I have attempted to begin as simply as possible to determine what kind of oddball task is required to elicit the P300. The arduino shield produced by BYB has  a series of LEDs, shown in the picture to the right, that I have used in my first version of the task. We coded the LEDs to flash in a random sequence with the oddball stimulus flashing 10% of the time, as a smaller probability of seeing the oddball predicts a larger amplitude and more easily detectable P300. The standard and oddball LEDs were assigned to corresponding digital outputs on the arduino and were wired into the analog input so that each flash could be detected on the Spike Recorder app. In the picture below, the green signals represent the standard LED flash and the red represents the oddball LED. Using this method, we can see what occurs 300 ms after the oddball LED is flashed. To ensure that attention is required to detect the oddball, we began by using one green LED as the standard stimulus and the other green LED as the oddball flashing 10% of the time. After getting no response in that department we tried other colored LEDs as the oddball, thinking that two green LEDs may be too similar since the oddball stimulus is intended to be more novel than the standard. No P300 was observed there, either.

example recording (3)

We have written another oddball task using LEDs in which the LEDs randomly flash two at a time. The task of EEG-wearer is to count how often symmetric stimulation occurs across the LED midline. This task gives a more novel oddball and hopefully an easily detectable P300! More oddball options are in the works, including small images for a visual oddball and auditory tasks as well! Stay tuned 🙂

kylie setup 1 (2)