-
 EducationCan we enhance our learning and improve memory recall during sleep? Apparently, sleep does have secret powers! It has been recently discovered that such magic can happen through targeted memory reactivation during sleep. Studies have shown that by associating a sound cue while learning to perform a specific task, you can then play that cue […]
 -
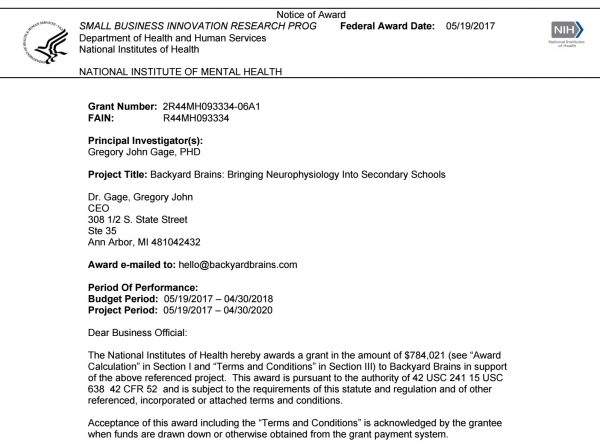 BizFour more years… of Science! It is an exciting day at the Backyard Brains office! After much revision and consideration, we have secured further NIH grant funding to continue our development of neuroscience education tools and materials! If you are unfamiliar, the National Institute of Health (NIH) is a federal agency that is responsible for performing and funding […]
 -
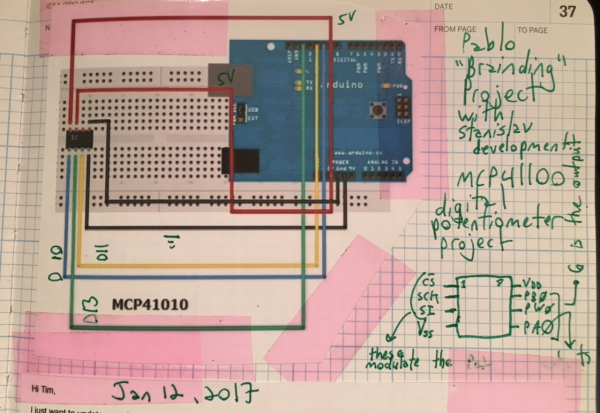 BizLongtime Backyard Brains fans may recognize Pablo Guerra in the majority of our human interface videos. When not acting for Backyard Brains, Pablo Works as Electronic Music Artist, specifically, modifying electronic music instruments in a discipline called “Circuit Bending.” Circuit bending or also called “toy hacking” is the art of corrupting a musical toy from […]
 -
EducationRamiz Kara is a freshmen at Emory University as a Pre-Med track, and he had some questions. He wanted to know the effects of meditation on brain waves and abstract problem solving, so he decided to make his own experiment to measure this, using our EEG device, the Heart and Brain SpikerShield. Although he didn’t find conclusive […]
-
 ExperimentHello again! This is the mind-reader reporting to you with updates on my project. I have had quite the scientific adventure since last sharing my research so sit down, grab your tea (or coffee or pop or kool-aide – I don’t judge) and prepare for a rollercoaster. With no success from LED oddball tasks, I moved […]
 -
 EducationWelcome! This is Kylie Smith, a Michigan State University undergraduate writing to you from a basement in Ann Arbor. I am studying behavioral neuroscience and cognition at MSU and have been fortunate enough to have landed an internship with the one and only Backyard Brains for the summer. I am working on The Consciousness Detector […]
 -
 EducationThis past August, we were graciously invited by ZAST (Zhejiang Association for Science and Technology) to come to China to give a series of workshops and talks in Hangzhou, Ningbo, and Shanghai at the various impressive science museums there. Similarly to the United States, Neural Engineering is a relatively new discipline for the public, and […]